GeoMarketing Wiki
GeoMarketing is a marketing field in which territorial information are analysed to reach different goals.
Usually, those information regard population data such as:
- Inhabitant
- Family
- Foreigner
- Income
- … (visit the full table)
and company’s information such as:
- Turnover
- GLA
- Fidelity cards
- Competitors
By analysing such information, entrepreneurs and analysts can take informed decisions such as store opening or closing, sorting points location, advertising campaigns, turnover estimates, and lot’s more. Each study is represented on the Map for a better understanding of the data. Nowadays there are different software that can be used to run Geomarketing analysis and obtaining report. One valid alternative is uGeo, developed by Urbistat. For more information on Geomarketing, please visit the following page.
Index
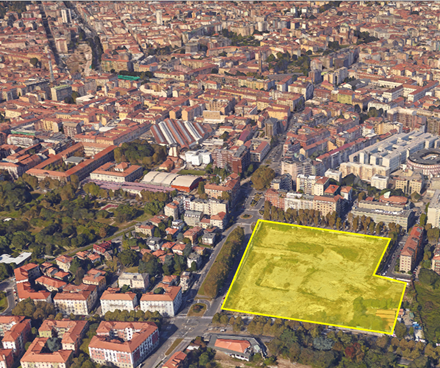
Territorial analysis following a possible opening of a new shopping center.
Those of you that dive into GeoMarketing for the first time, may meet some unfamiliar terms. Below we explain the meaning of some of them:
Acronyms
GIS – (Geographic Information System) it is an IT program developed to process geographical areas (regions, province, and cities), graphs (roads, rivers) and points (POI, poles).
POI – (Point Of Interest) rapresents a specific place on the map that is of particular interest to the user. In the case of satellite navigators, a typical example of POIs is represented by petrol stations.
GDO – (Large Organized distribution) refers to a series of point of sales generally organized as self-service, with large showroom, in which common goods are sold, and belonging to a single company or chain.
Some examples Of GDO are: Esselunga, Coop, Conad, Unieuro, Mediaworld, Arcaplanet, La Piadineria.
NUTS – (Nomenclature of Statistical Territorial Units) rapresents a subdivision of the Europian territory made by Eurostat (Europian Union Statistical Office) for statistical purposes. For example, UK is aggregated into 4 different levels, NUTS 0 refers to the entire state, while NUTS 3 stand for leeds.
CIN – (Consumption Index Number) is an index value that indicates the variance in consumption of a given geographcal area (be it an administrative border or an area traced by the user) compared to the national average.
Eg. Granata in 2018 has a NIC of 95 compared to the National average 100; in other words the population of Granata spends 5% more than the Spanish average. To know more press here.
IIN – (Income Index Number) as for consumption, it is a index representing the difference income compared to the national average.
Ex: Stoccarda has a NIR 115, meaning that the population of Stoccarda has an income that is 15% higher than the National average 100. To know more about it press here.
CSV – It is a format of file commonly used to save a small collection of data. CSV file is based on a text file where each information in separated by a predefined character. The most frequent separator field is “;”. Ex: “Tony”;”Bruxelle” “Shara”;”Madrid”
CRM – (Customer Relationship Management) It is a set of marketing activities aimed to improve the relationship between the company and its customers, to maximize customer satisfaction, their fidelity, also working on strengthen the word of mouth for new potential customers.
C.C. – (Cadastral Cartography) It is a cartography containing data from the Cadastrel database. It can be consulted through GIS software.
Terms
Database – It is a collection of data usually collected on a server that can be easily questioned trought “Query” commands.
Big data – It is usually associated with all hardware and software technologies for managing large databases.
Trade area analysis – Represents the study of a store linked to the maxmium area of territory covered by its customers.
Isochronous – In a geomarketing software, it is the visual representation of a catchment area calculated on the basis of timing (car, pedestrian, …)
Player – In geomarketing, it rapresents a Brand/Banner.
Brand – It’s the brand/symbol with the purpose of identifying the products and services of a chain of sellers, and differentiating them from those of competitors.
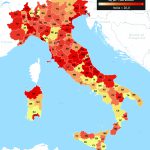
Thematic maps – Visual representations of the map, in which certain aspects wants to be highlighted.
Eg. Starting from a normal map of the territory, a thematic map could be created in which the areas with a higher number of foreigners are displayed with increasing colour intensity.
Poli – Are points on a map (like nodes in a graph) which allow you to schematize data via software as real as the road network.
High streets – Rapresent streets of high commercial importance. Usually they are located in historical centres.
Turnover estimate – It is a very common activity in Geomarketing analysis. The ultimate goal is to estimate how much a store will invoice after major changes in the economic system of the analysed area. Eg. Opening of a new store of a competitor.
Overlap – Another very common operation in Geomarketing analysis. Overlap analysis allows you to visually represent either the part of the territory subject to gravitational attraction for our store, and the part of the territory that would be subject to attraction but is not due to the presence of other competitors.
Marketing research – It is a Marketing analysis designed to investigate the economics behaviour of a specific area.
Surveys – Marketing research carried out by collecting consumers opinions about different topics, to discover habits and needs.
Natural Balance – It is the difference between the number of births and the number of deaths. It is representative of a territory to indicate the population trend (growth or decrease).
Migration balance – It is the difference between immigrants and emigrants, even expressed as the difference between those who moved to the territory and those who left the same territory.
Total balance – In Geomarketing, It is the sum of the natural balance and the migratory balance.
Birth rate – It is the annual number of births per thousand inhabitants. The formula is: (Birth / Average population) * 1.000.
Mortality rate – Annual number of deaths per thousand inhabitants. It is calculated with the following formula: (Deaths/Average population)* 1000
Migration Rate – annual number of immigrants per thousand inhabitants. It is calculated with the following formula (Migration balance/ Average population) * 1000.
Growth Rate – It is the number of people who settle down in a given territory in a year. It calculated with the following formula: Birth rate + Migration rate – Mortality rate.
Active Population – Number of individual in a given territory, who are able to work
Inactive Population – Number of individuals in a territory who cannot work (retired, children and disable people).
Unemployed Population – It is the number of people who can work but do not work, in a given territory.
Below we propose an explanatory video in which a typical Geomarketing operation is carried out through our uGeo software.
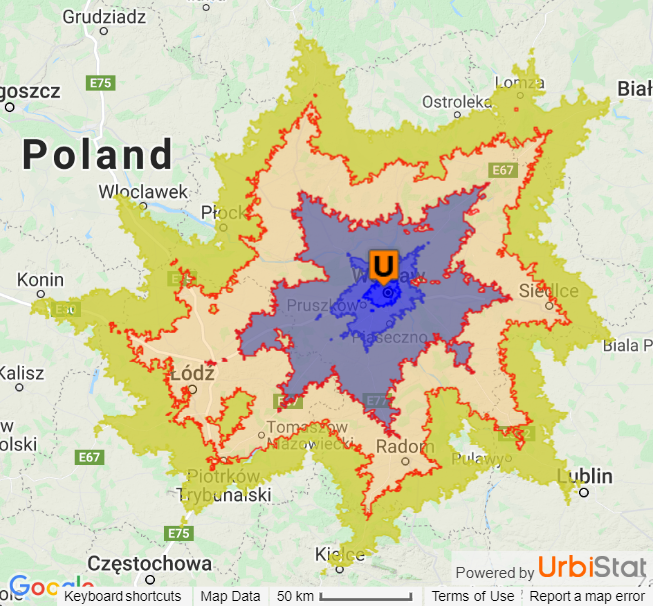
In detail, the Geomarketing operation is called Catchment area. A Catchment area is a study of the population gravitating around the point of interest, divided by isochronous zones.
Video
Video tutorial of a catchment area made in Amsterdam.
Gallery
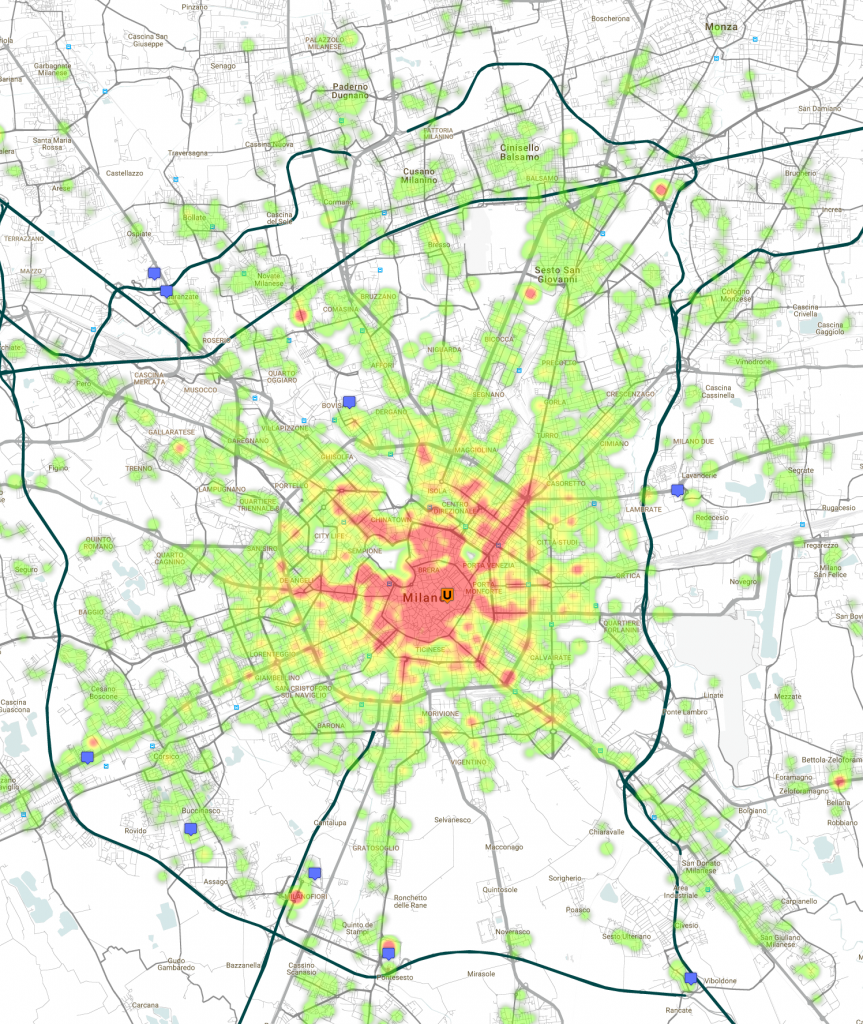
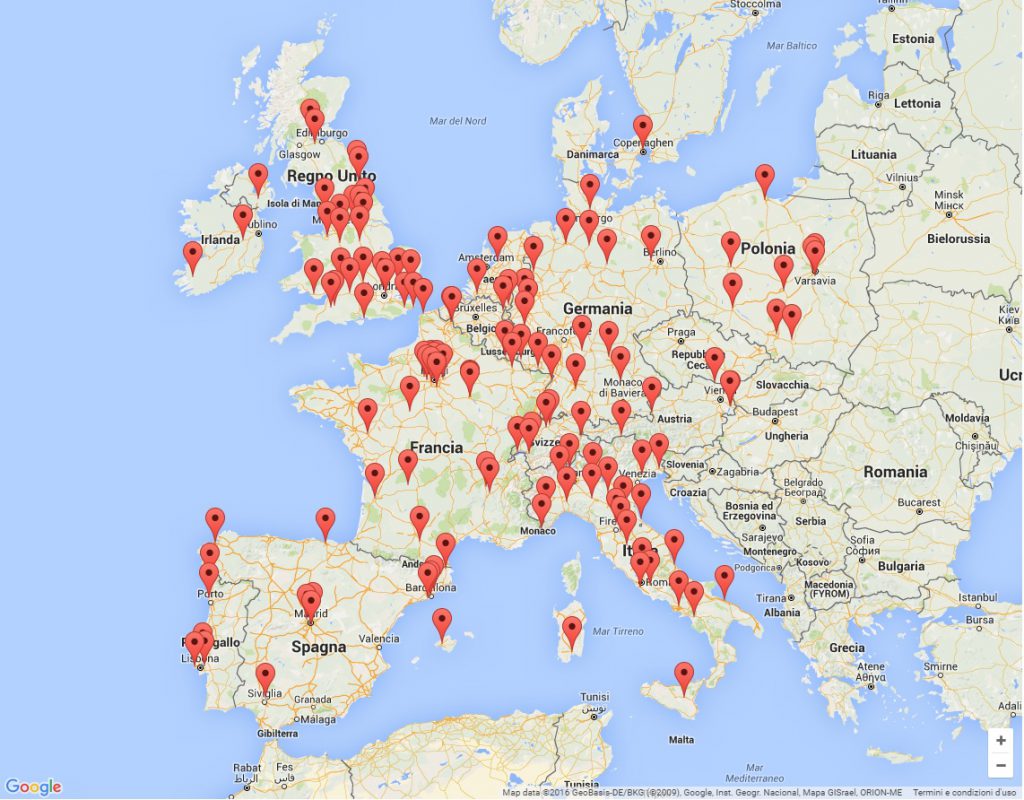
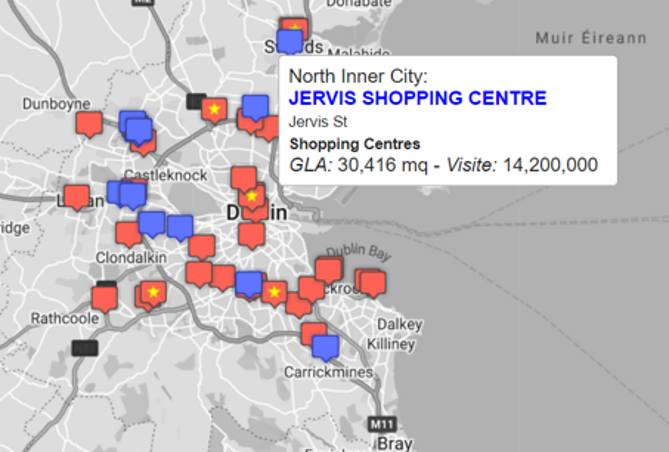
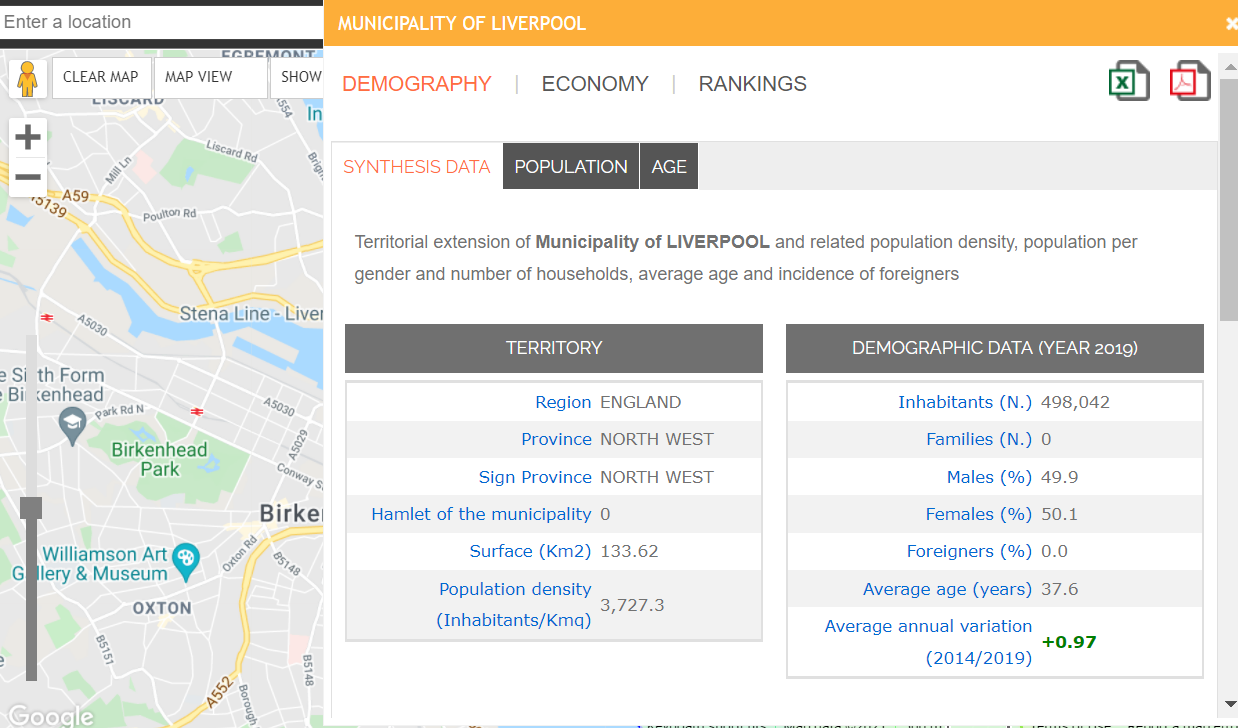
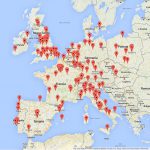
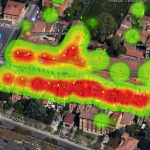
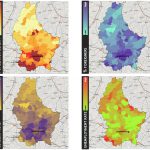
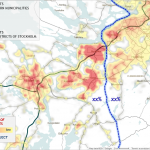
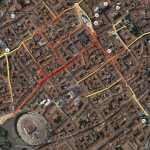
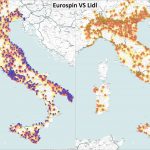
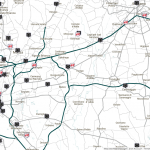
We show some Geomarketing visualization carried out with our Ugeo software.
External Links
uGeo geomarketing software – https://www.urbistat.com/ugeo-software-geomarketing/
Geomarketing Terminology Wikipedia – https://en.wikipedia.org/wiki/Geomarketing
Quantum Gis – https://www.qgis.org/en/site/
Adminstat territorial statistics – https://ugeo.urbistat.com/AdminStat/en
News about/ around Geomarketing – https://www.urbistat.com/blog/?layout=timeline

